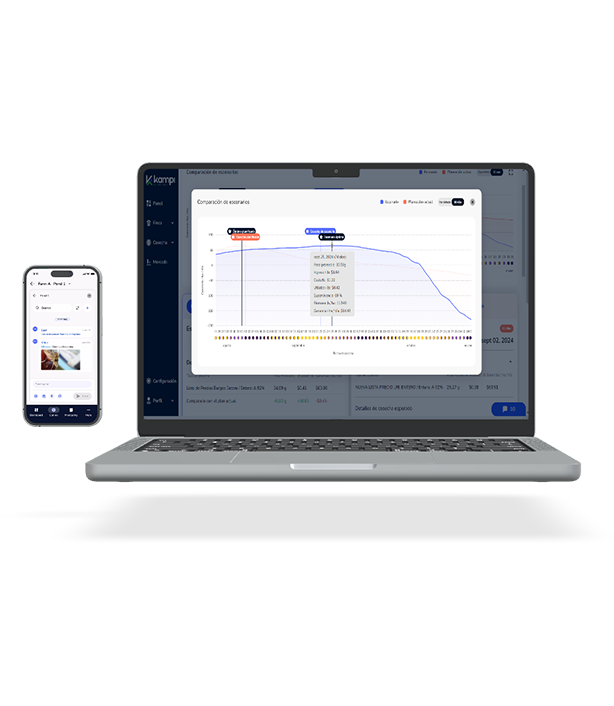
This module is a powerful analytical tool that keeps you informed about the effectiveness of your entire shrimp farm management, its processes and variables, through a user-friendly interface, from your mobile devices, anywhere. It even eliminates the need to be continuously physically present on the farm.
This unique tool clearly offers a consolidated view of all your farm data, giving you the ability to execute a comprehensive analysis on a single screen, to make production decisions assisted by a model that’s always active, always updating for you.
Optima can perform over 100 graphical variations on your farm’s performance in seconds, just a click away! The centralized data view allows you to quickly detect and connect variables and interpret data like never before. No more endless hours investing in data entry and building pivot tables. Hiring staff to digitize information will no longer be necessary. Gone are the days of updating your farm data in non-intelligent, previous-generation software like Excel and PowerBI. With this tool, you’ll have a completely new perspective on your farm operations, to bring different processes to maximum efficiency and profitability.
Some examples of what you can do with Optima Analytics. The possibilities are endless:
-
- Compare feeding efficiency between ponds by evaluating actual nutrition performance.
- Monitor your FCR vs. production cost.
- Analyze survival rates vs. feed consumption.
- Calculate cost per kg of feed vs. gain per hour per day.
- Evaluate density and feed cost (and see their correlation).
- Compare density vs. growth.
- And much, much more…


